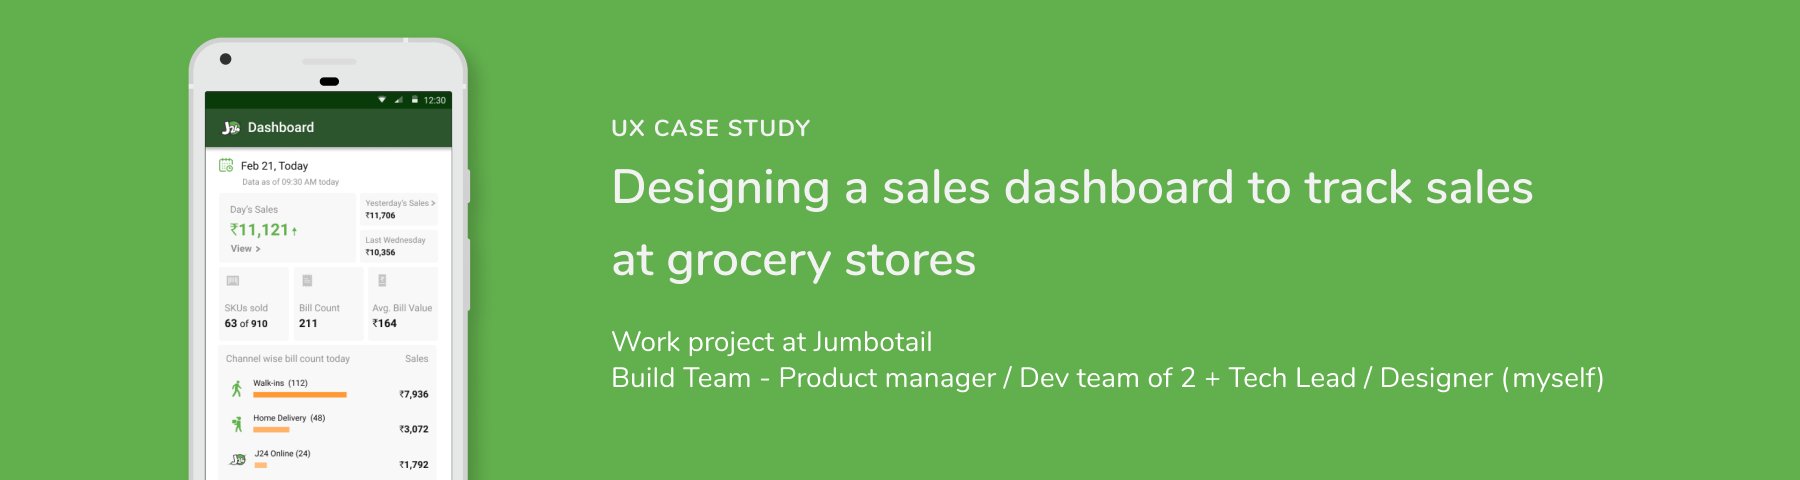
At Jumbotail we focus on solving for neighbourhood grocery stores, by providing them an online platform to order items, build applications that help the store operations / processes run efficiently reducing bottlenecks and equip the mom & pop stores with necessary and user friendly tech stack. This is my first UX project at Jumbotail which helped me understand complex systems like retail supply chain and learn more about designing for mobile first retail store users in India

A kirana store owner
overview
Building apps for grocery stores
A typical day at a neighbourhood grocery store not only involves selling us the essentials but also has a lot of backhand operations like
- Billing terminal and maintaining stock level data accuracy for online sales
- Managing distributors and deliveries
- Tracking sales and payments through multiple sales channels
- Online orders, home delivery orders for increased revenues through multiple channels
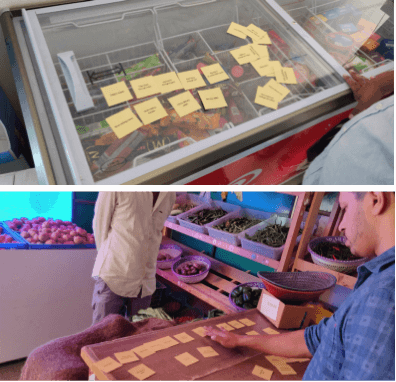
There are lot of bottlenecks / operation hiccups in the current process at these stores.
The old web dashboard
Issues with current solution
Old dashboard
The current web dashboard roled out to the grocery store owners are tweaked version of an internal analytics portal. It is found that the store owners were not using the dashboard to track their sales though there is a need for such app. Most kirana store owners are mobile first users and are not comfortable with opening and checking a web based dashboard daily.
Stickiness of web dashboard
(measured by data team average number of active user days in a week)
Less than 1
what outcomes do we want to see?
Provide a mobile dashboard for store owners to easily track store sales and payments everyday.
The behaviors we are driving
- Track sales through multiple channels regularly
- Easy payment reconcilliation on store closing
- Keep track of store sales metrics everyday
- Identify dead stock in store
The behaviors we’re discouraging
- Lack of clarity about accurate sales performance
- Not monitoring store transactions everyday
- Re-ordering dead stock again due to sales push from vendors
Stickiness of web dashboard
(measured by data team average number of active user days in a week)
More than 3.5
Understand
What are store owner’s priority metrics?
Behaviour questions and data points for research
01
What are the primary metrics the store owners track other than the day's sales?
02
How do they track and compare their sales to assess the performance for the day?
03
Do store owners understand graphs that visualize monthly sales?
Relevant metrics listed down for card sorting
Understand
Card sort research
How do we know that what sales data is important for the store owner to track everyday. To probe the user and find out what metrics really matter for them, we did a closed card sorting exercise with the store owners. This helped us to understand what metrics they really prioritized and what data points are not relevant or of less priority for them.
Relevant metrics listed down for card sorting
Understand
Research findings
- All the retailers reduced the number of cards they prioritised indicating that too much metrics adds to information overload

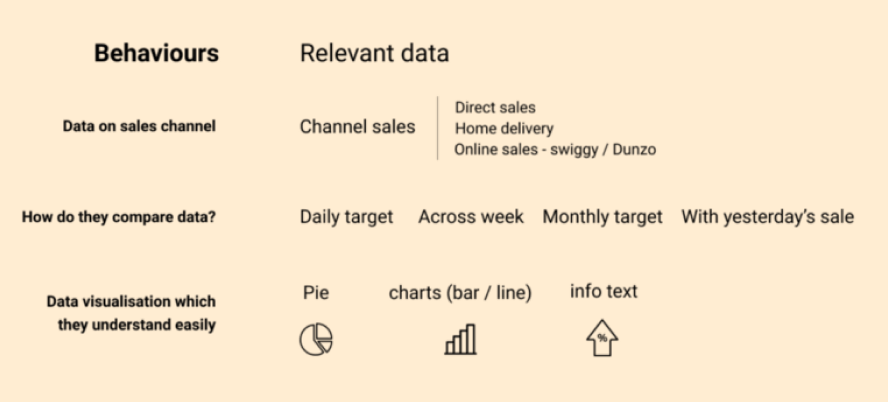
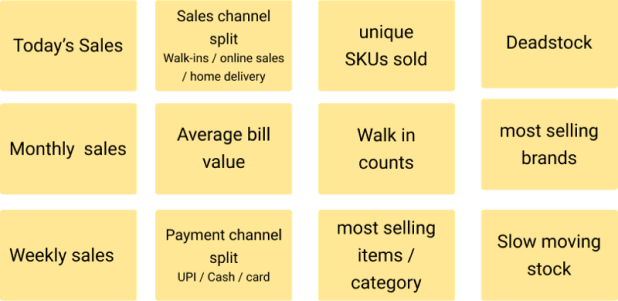
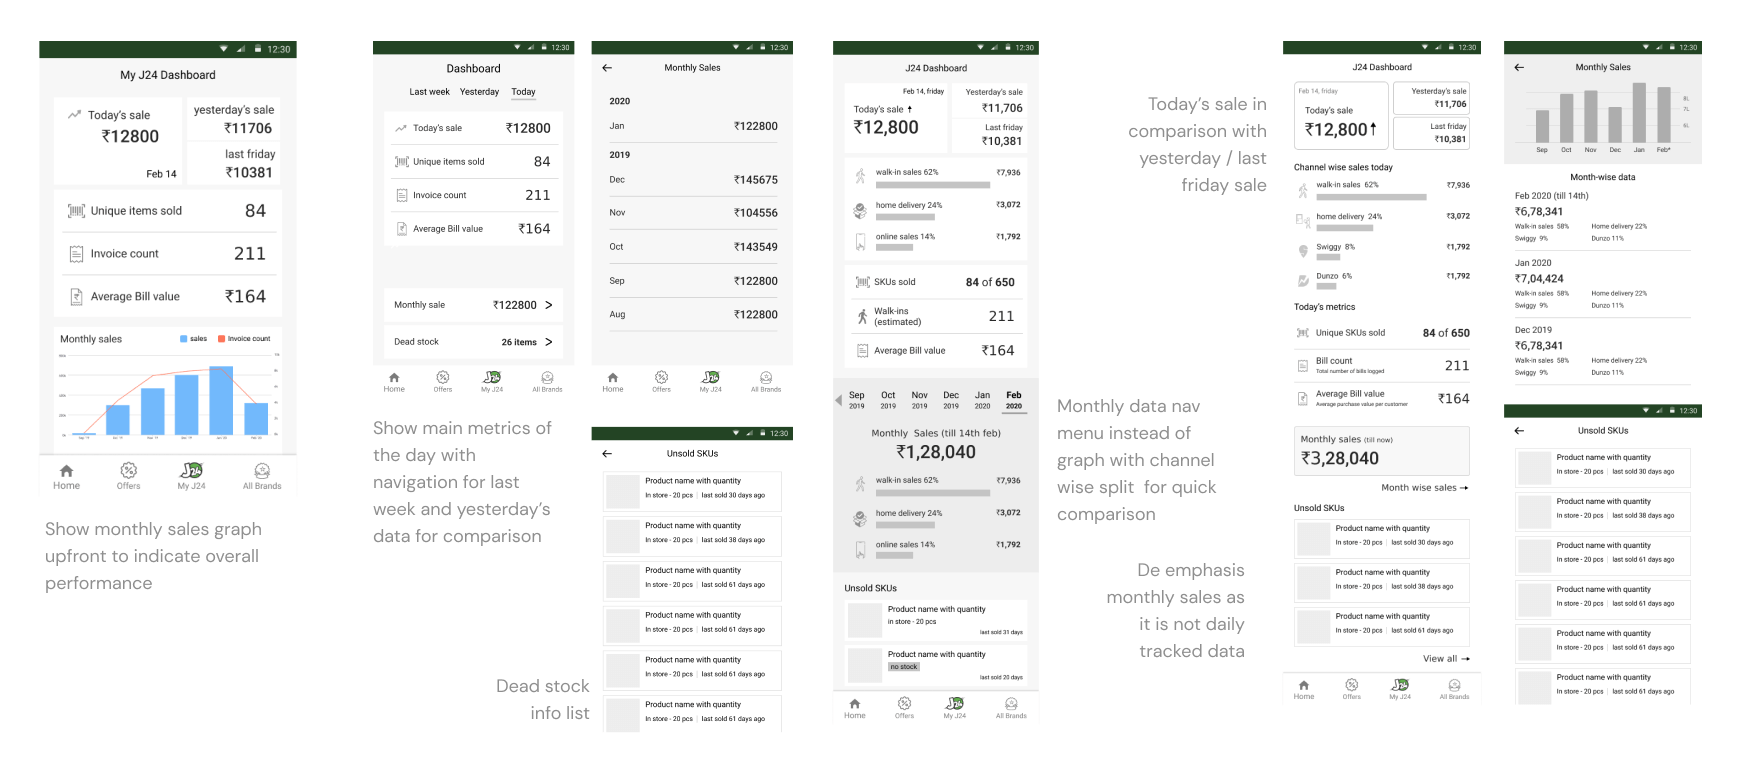
- Daily tracked metrics are overall sales and payments through different channels, walk-ins in store

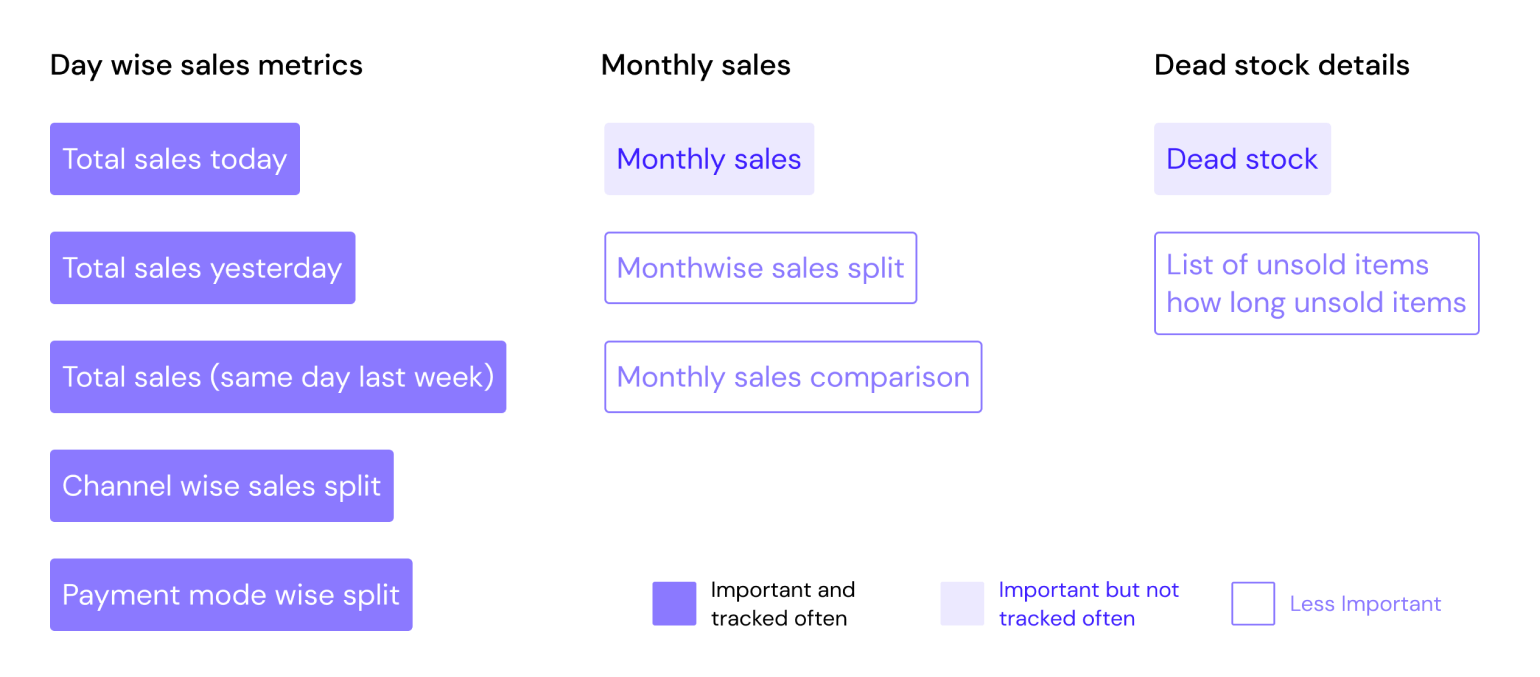
- Today's sale is sometimes compared to last week same day sales and few of them compared it to yesterday's sales to assess the sales performance

- Monthly sales figure is an important metric tracked once in a while but not daily

- Quick understanding of sales figures is important than graph and pie chart visualisations

- Dead / low selling stock info has been found more important to retailers than most selling. This info shows the unsold stock clearly to the store owner and helps in procuring decisions
Understand
Affinity map of relevant features
affinity map of features
Define
Job stories
01
When assessing the store sales for today, I want to quickly access the latest sales information across different sales channels and compare them ( with yesterday’s or last week day’s sales ), so that I will know how the sales performance across channels for the day.
02
When doing payment reconcillation during store closing, I want to see all the total transactions across multiple payment modes at one place, so that I can confirm the cash in POS register / store account without the need to check across multiple applications and find any discrepencies if any.
03
When the distributor visits for order taking, I want to quicklt access the dead stock products info and gain knowledge of slow moving products in store, so that I don’t place order for items that is remaining unsold.
Define
Everybody deals with constraints

Data sync with Point of sale (POS)
The point of sale (POS) system at the store is where all the billing data is captured and acts as a source for tracking metrics. There are use cases where the POS is offline and the data shown in dashboard is not updated.
Part of existing E-commerce app
Store owners already use the online e-commerce app to order items for the store. Providing the dashboard accessibility for the store owners in the same app might allow ordering suggestions in the future scope.
Accuracy depends of POS billing data
Identify any assumptions and constraints you were dealing with. What stood in the way of your team achieving your goal? Were there any blockers? What was the timeline? What’s the scope? What’s the risk?
Design
Wireframe iterations
wireframe iterations
Design
Final design after review and testing

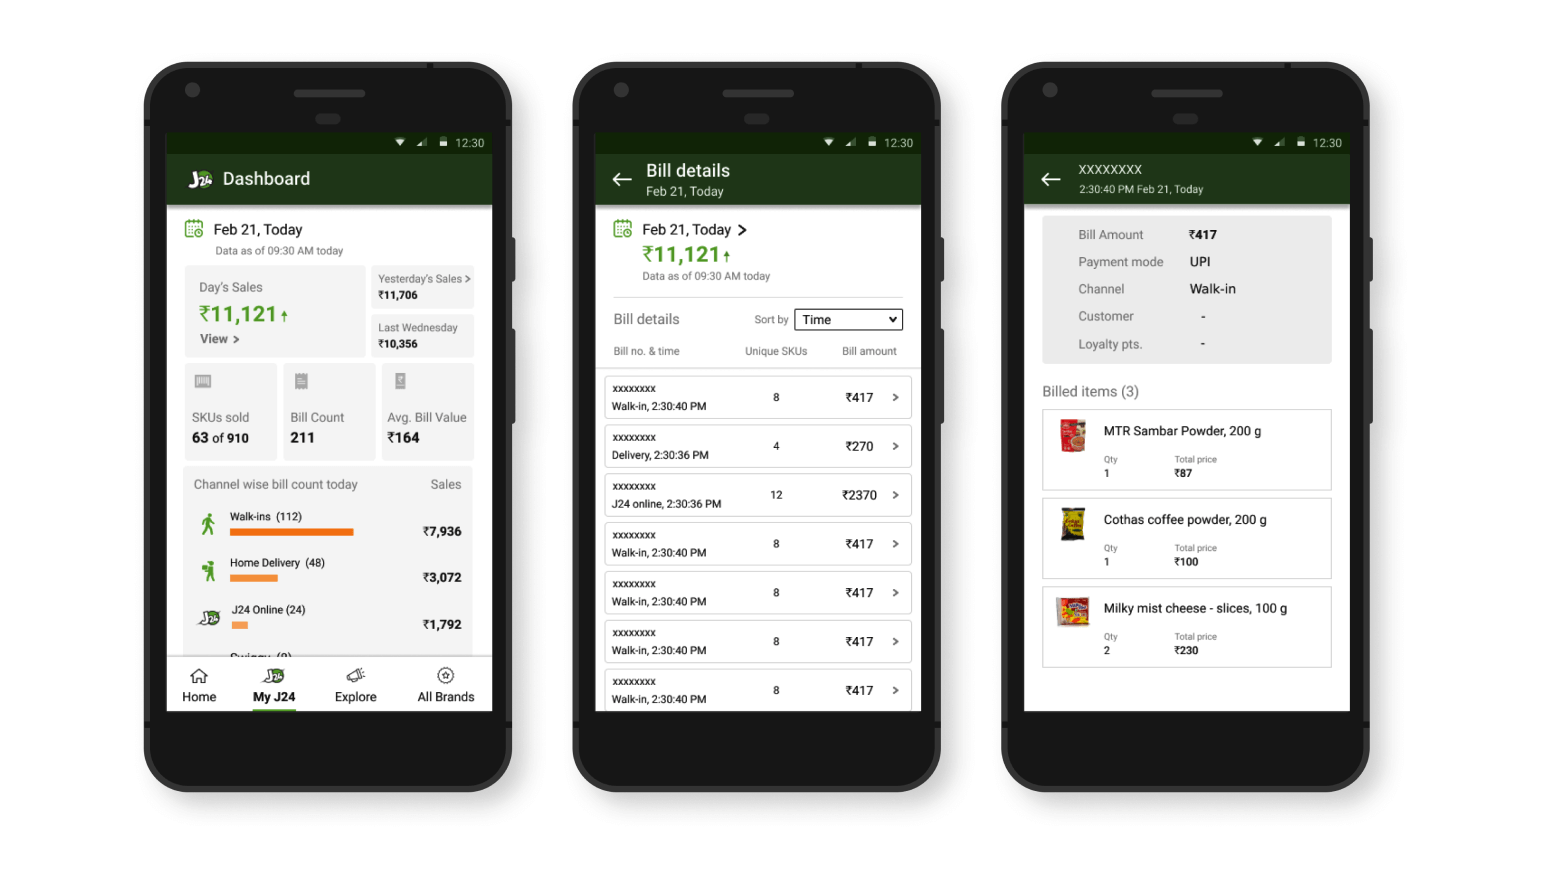
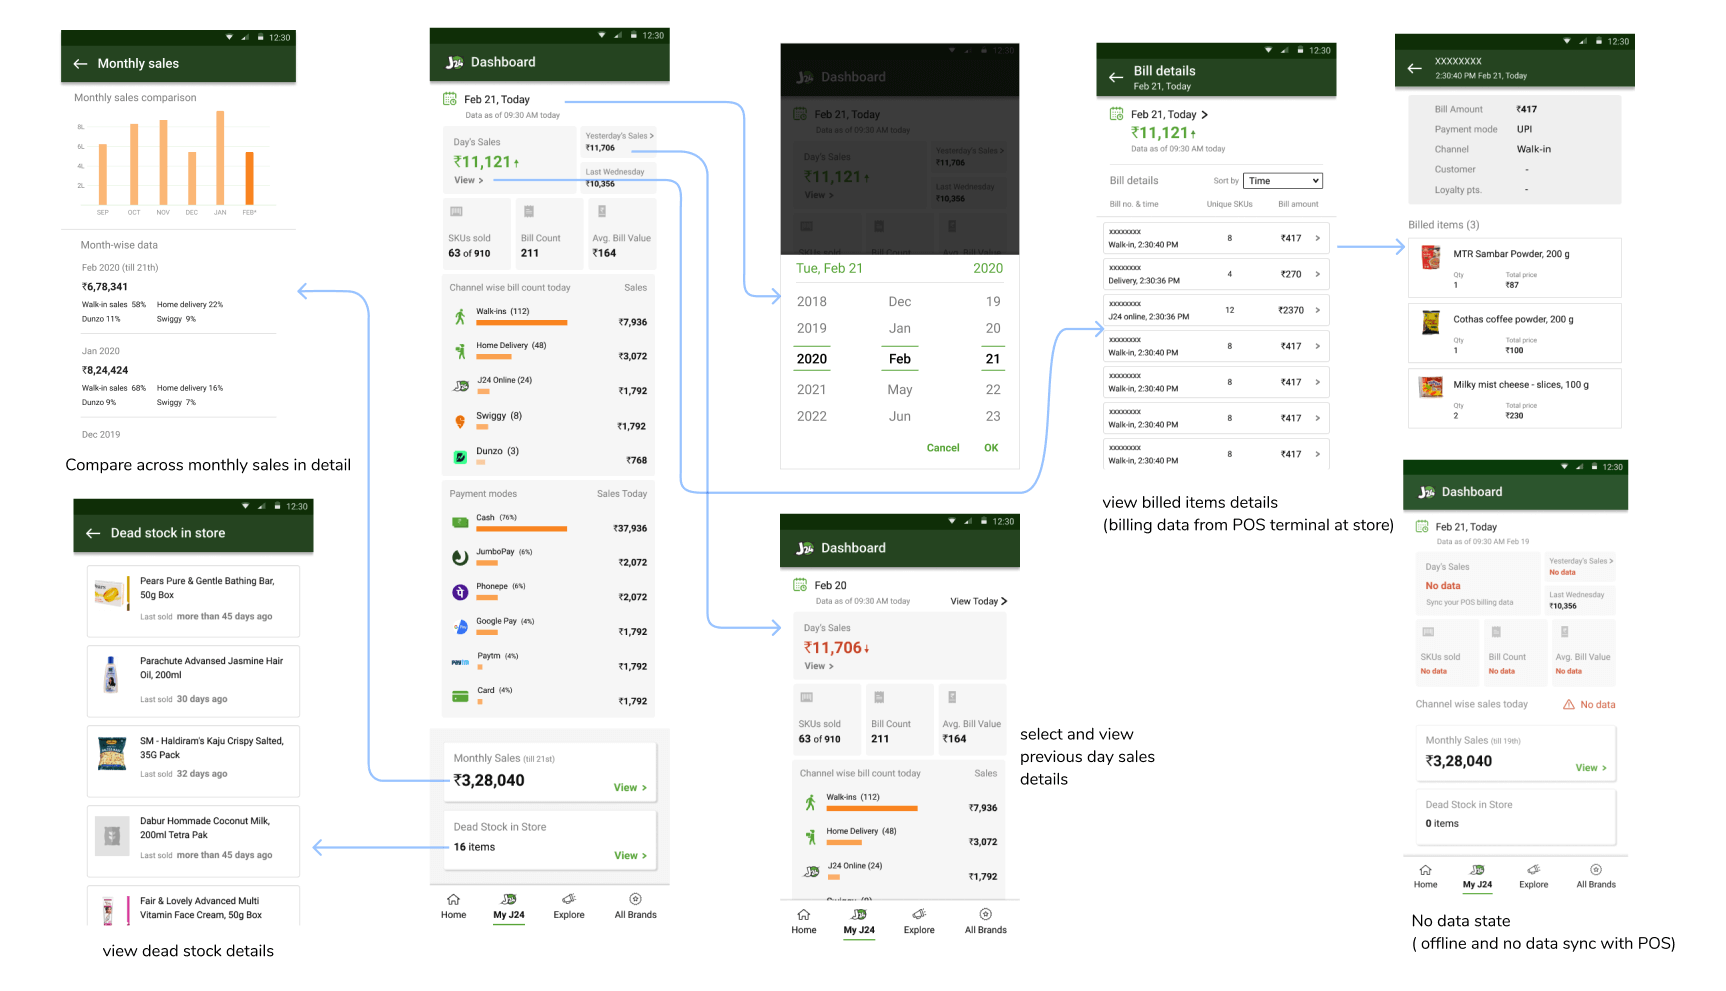
After reviewing the wireframe iterations with design peers, Product manager and Engineering / Business stake holders, and user testing few low fidelity prototypes,the final design is done with UI elements following the existing E-commerce app design style. The UI design is made to address clarity without much information clutter. Some of the low fidelity wireframes are user tested with a small customer group to identify clutter free design from customer’s perspective and validate intent. There might be additional use cases like POS data not flowing for the day or for last few days. In this case, a no data state is designed to showcase lack of data.

Final design and user flow

Outcome
Learnings and Outcomes

- My main learning of the project has been the process of understanding customer needs through qualitative research and data before building features. Understand and build what the user care about the most rather than overloading with features which we think as relevant.

- The main outcome of the project was to drive usage of dashboard by J24 store owners. The stickiness of the dashboard increased more than 4 as store owners found value in tracking sales everyday.

- Some of the store owners proposed feature improvements like bill level details that will be useful for them to live monitor store point of sales.

- The POS billing operation at store is a major component to maintain data acurracy and so efforts were thought out in operations to maintain point of sale billing for every order at store.

Bill level detail feature implemented after customer request


Main learning
“A good dashboard isn’t just lot of information thrown in the screen but a set of useful metrics that is relevant to the user and affects his business”